Insights
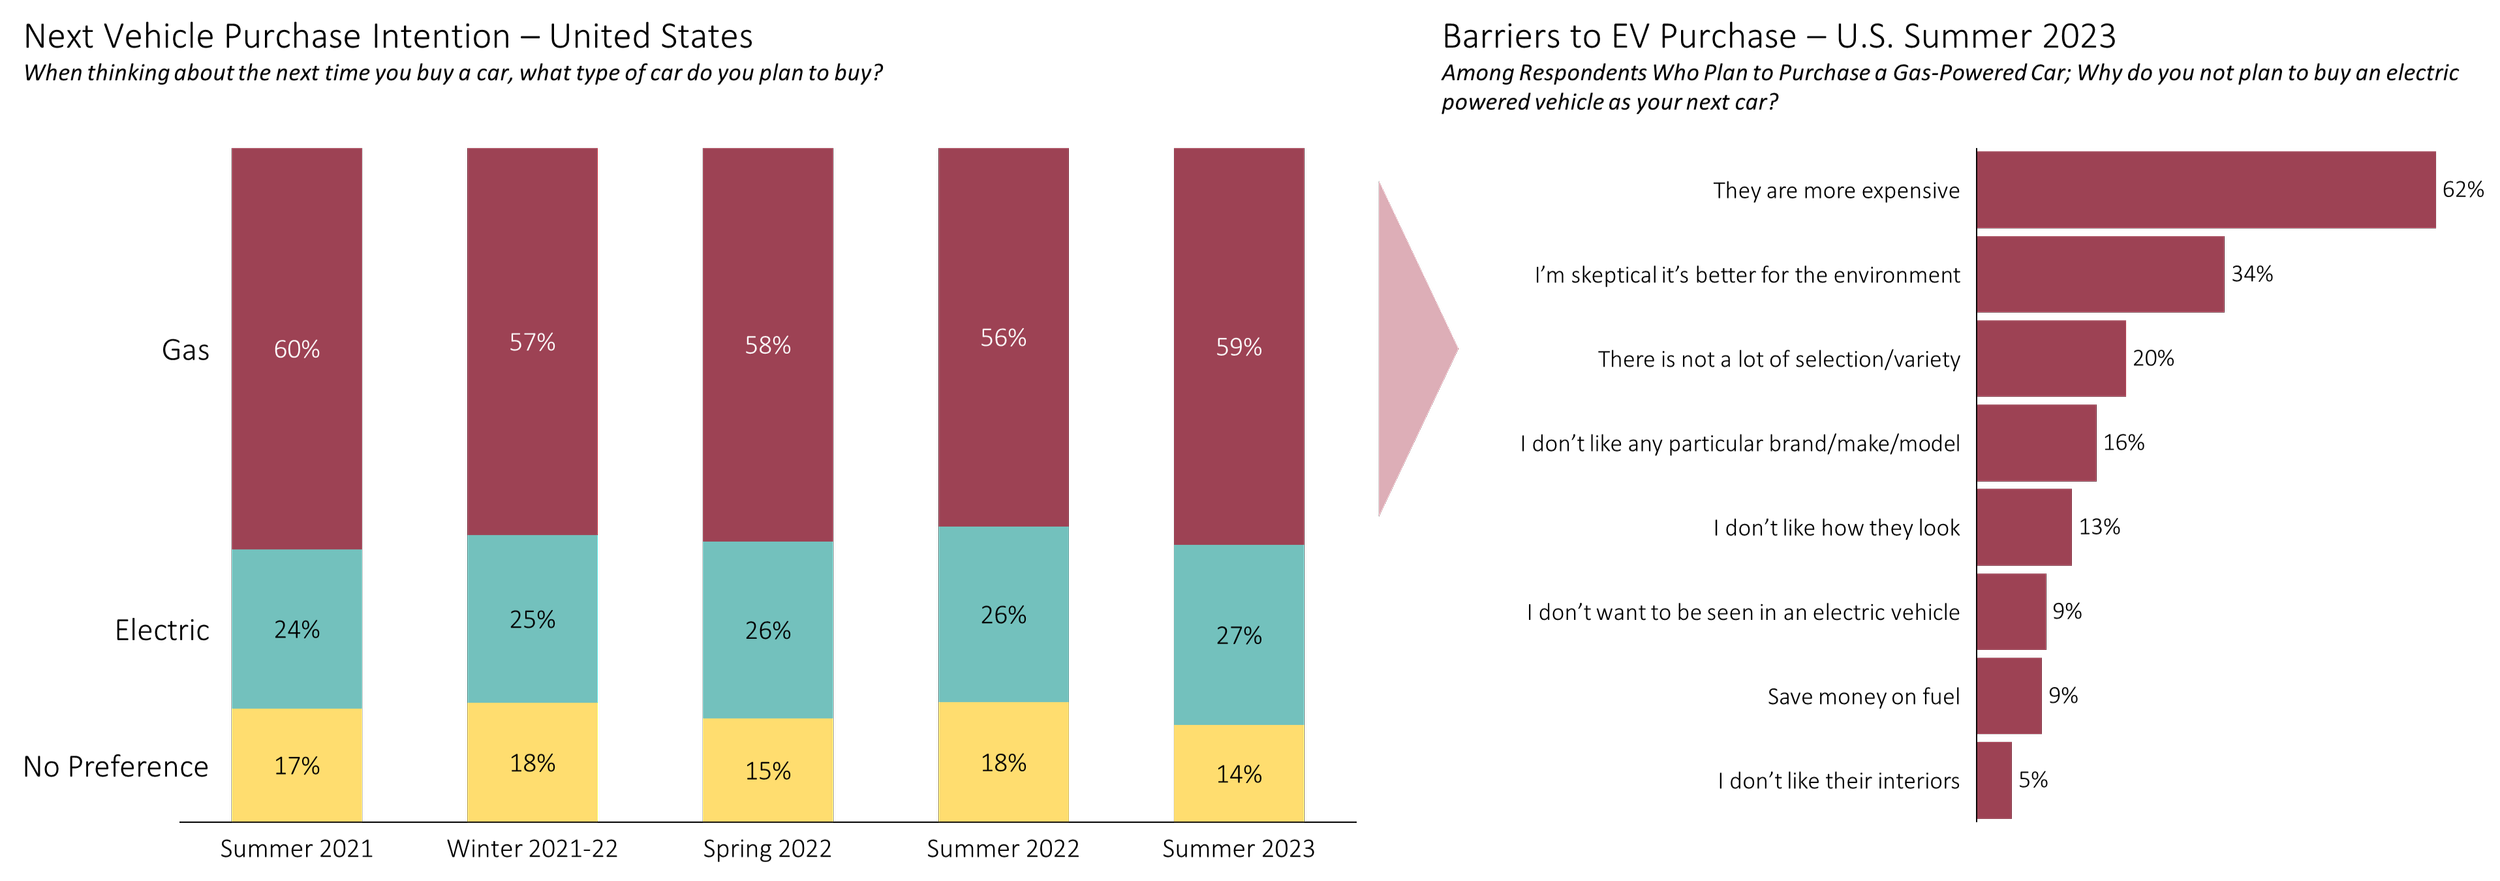
Insight 1: Consumers in the United States remain much more likely to purchase a gas-powered car than an electric vehicle.
Although there has been a slight improvement in the percent of consumers in the United States who plan to next purchase an electric vehicle, growing from 24% in the summer of 2021 to 27% in the summer of 2023, this is the result of shifting consumers with no preference to preferring an electric car. Those who planned to purchase a gas-powered car as their next vehicle cited price barriers first when asked why they do not plan to purchase an electric-vehicle instead, followed by skepticism towards the environmental benefits and a long tail of additional reasons. While a number of premium EV brands have entered the market in recent years, this could be an indication that there is an opportunity for a lower-cost brand to shift consumer perception and grow the market.
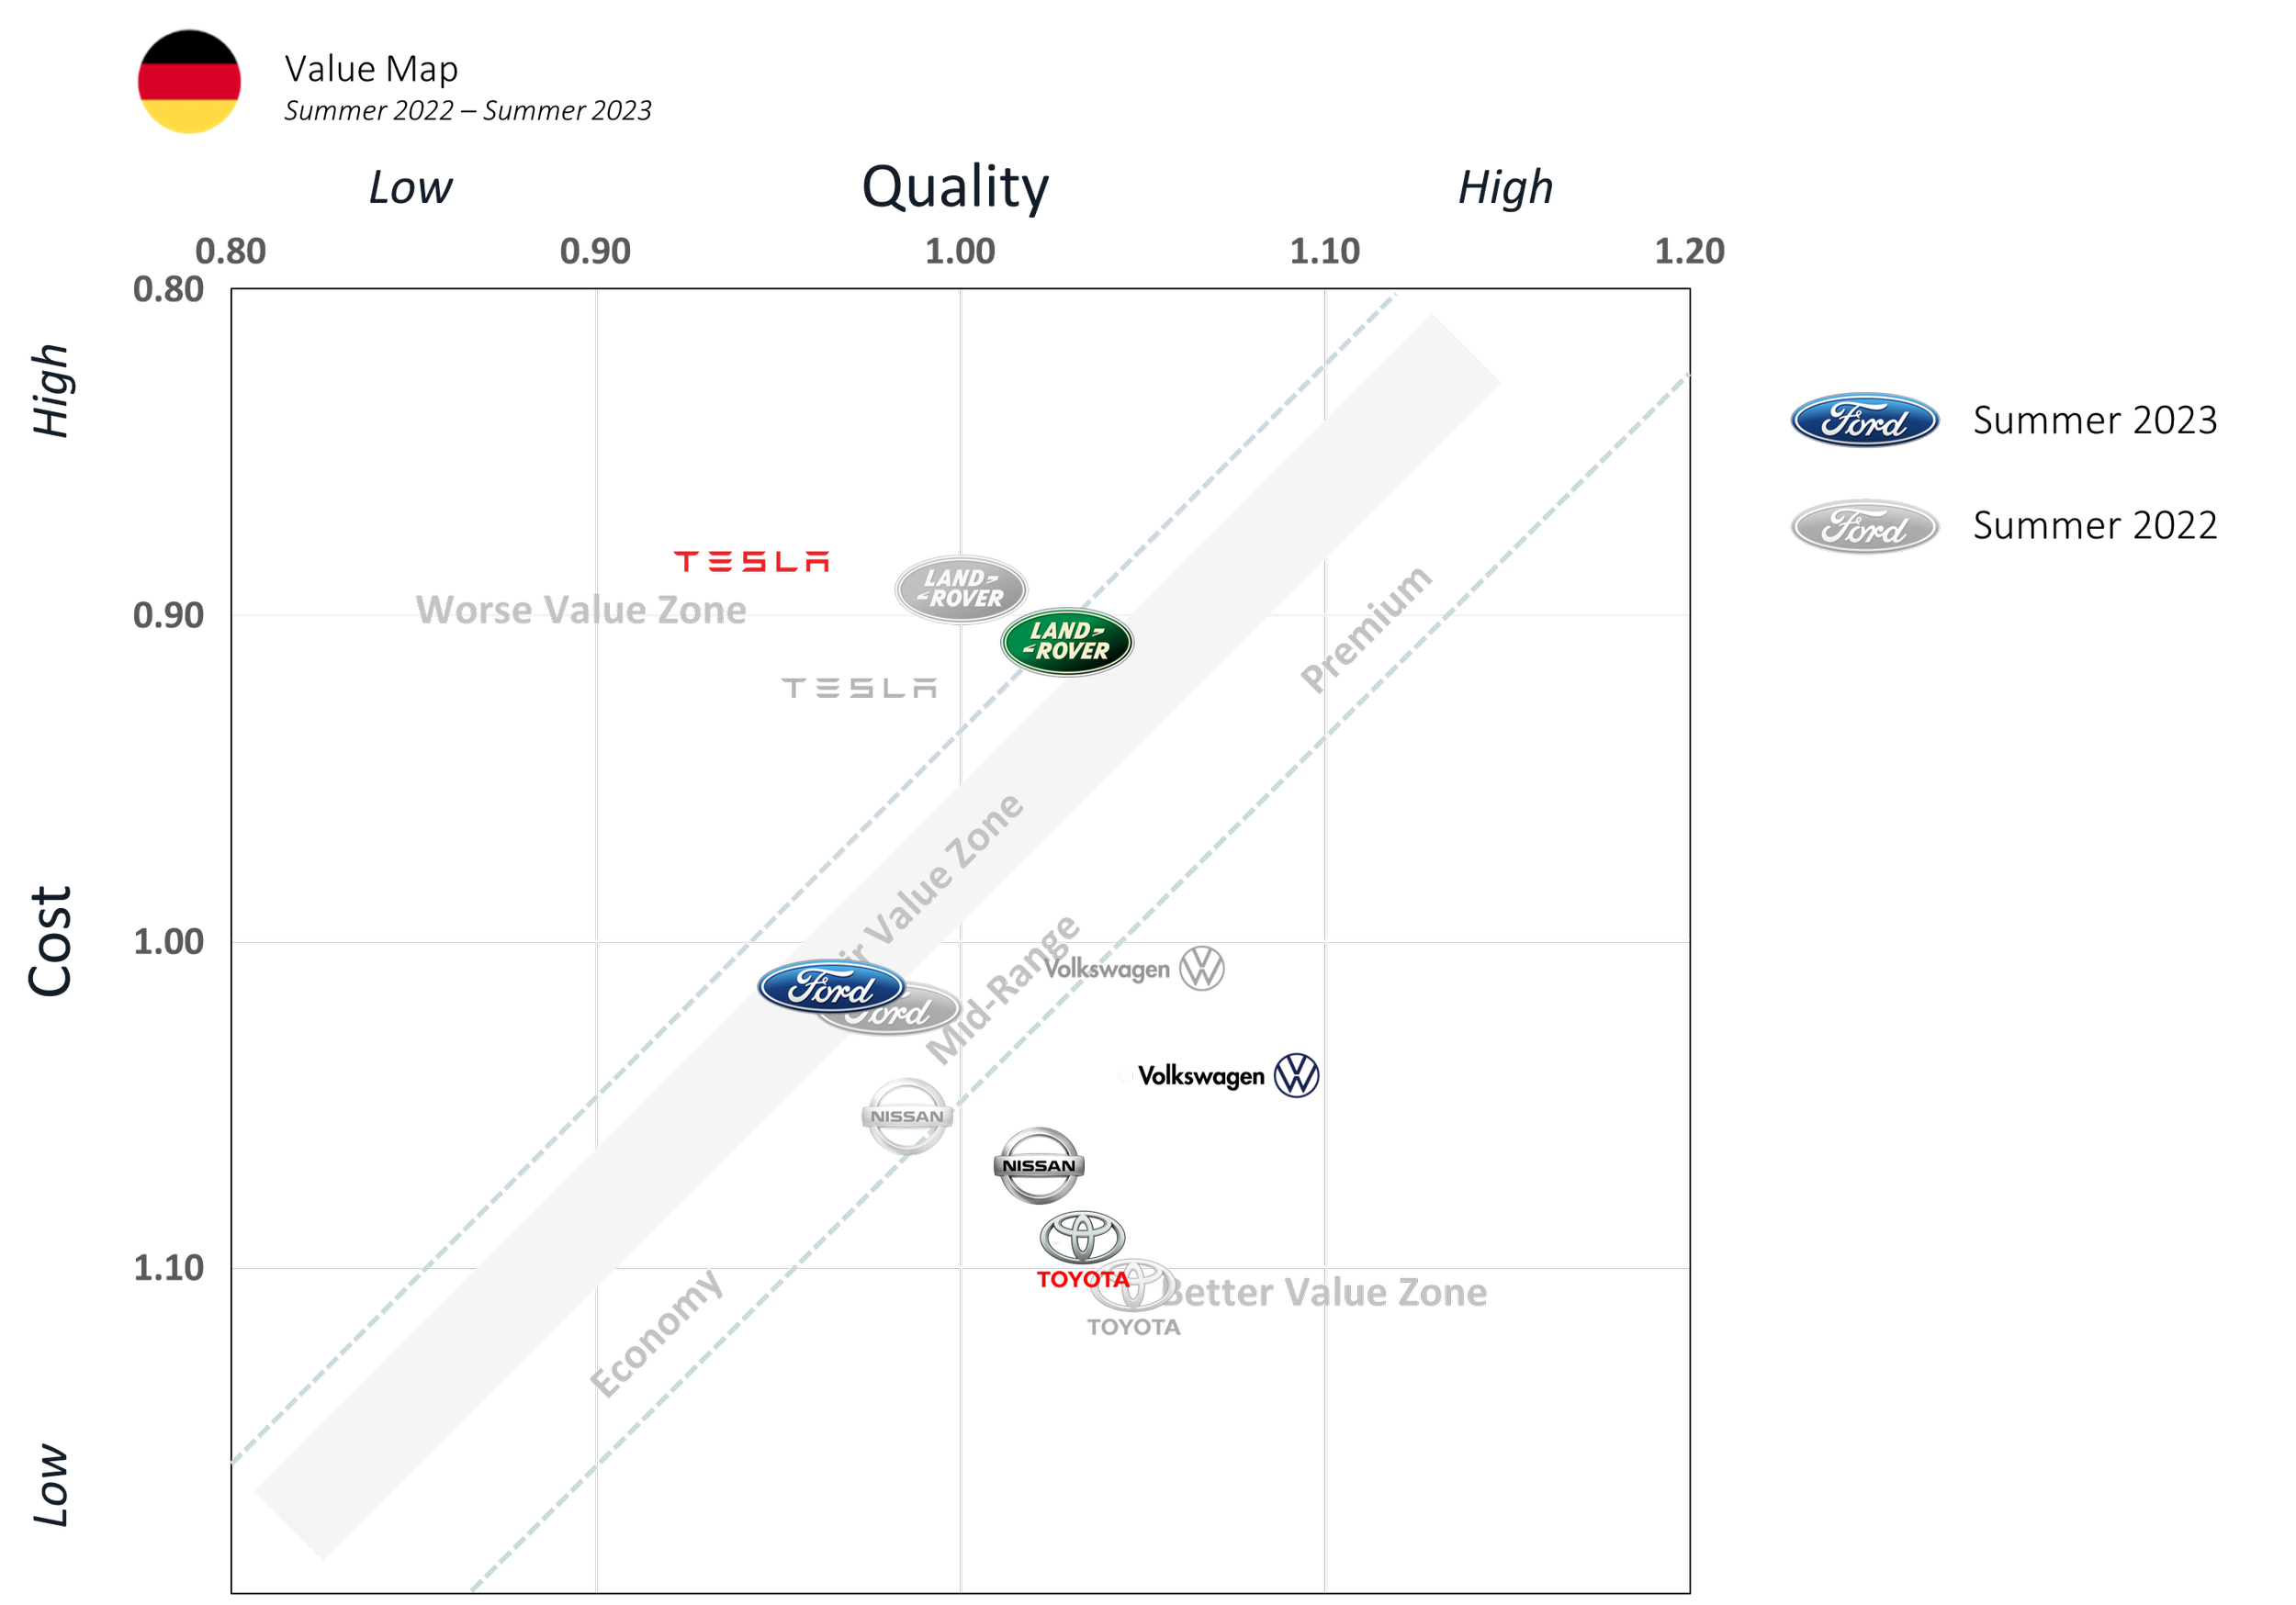
Insight 2: Consumers perceive Tesla to be less premium and lower quality relative to just one year ago, especially in Germany.
Tesla has slashed prices on many models, and while these moves have successfully driven sales growth, they seem to be affecting consumer perceptions of the automaker. This dynamic is more dramatic in Germany than the United States, where the brand has a smaller footprint and is facing increased competition from Chinese competitors.
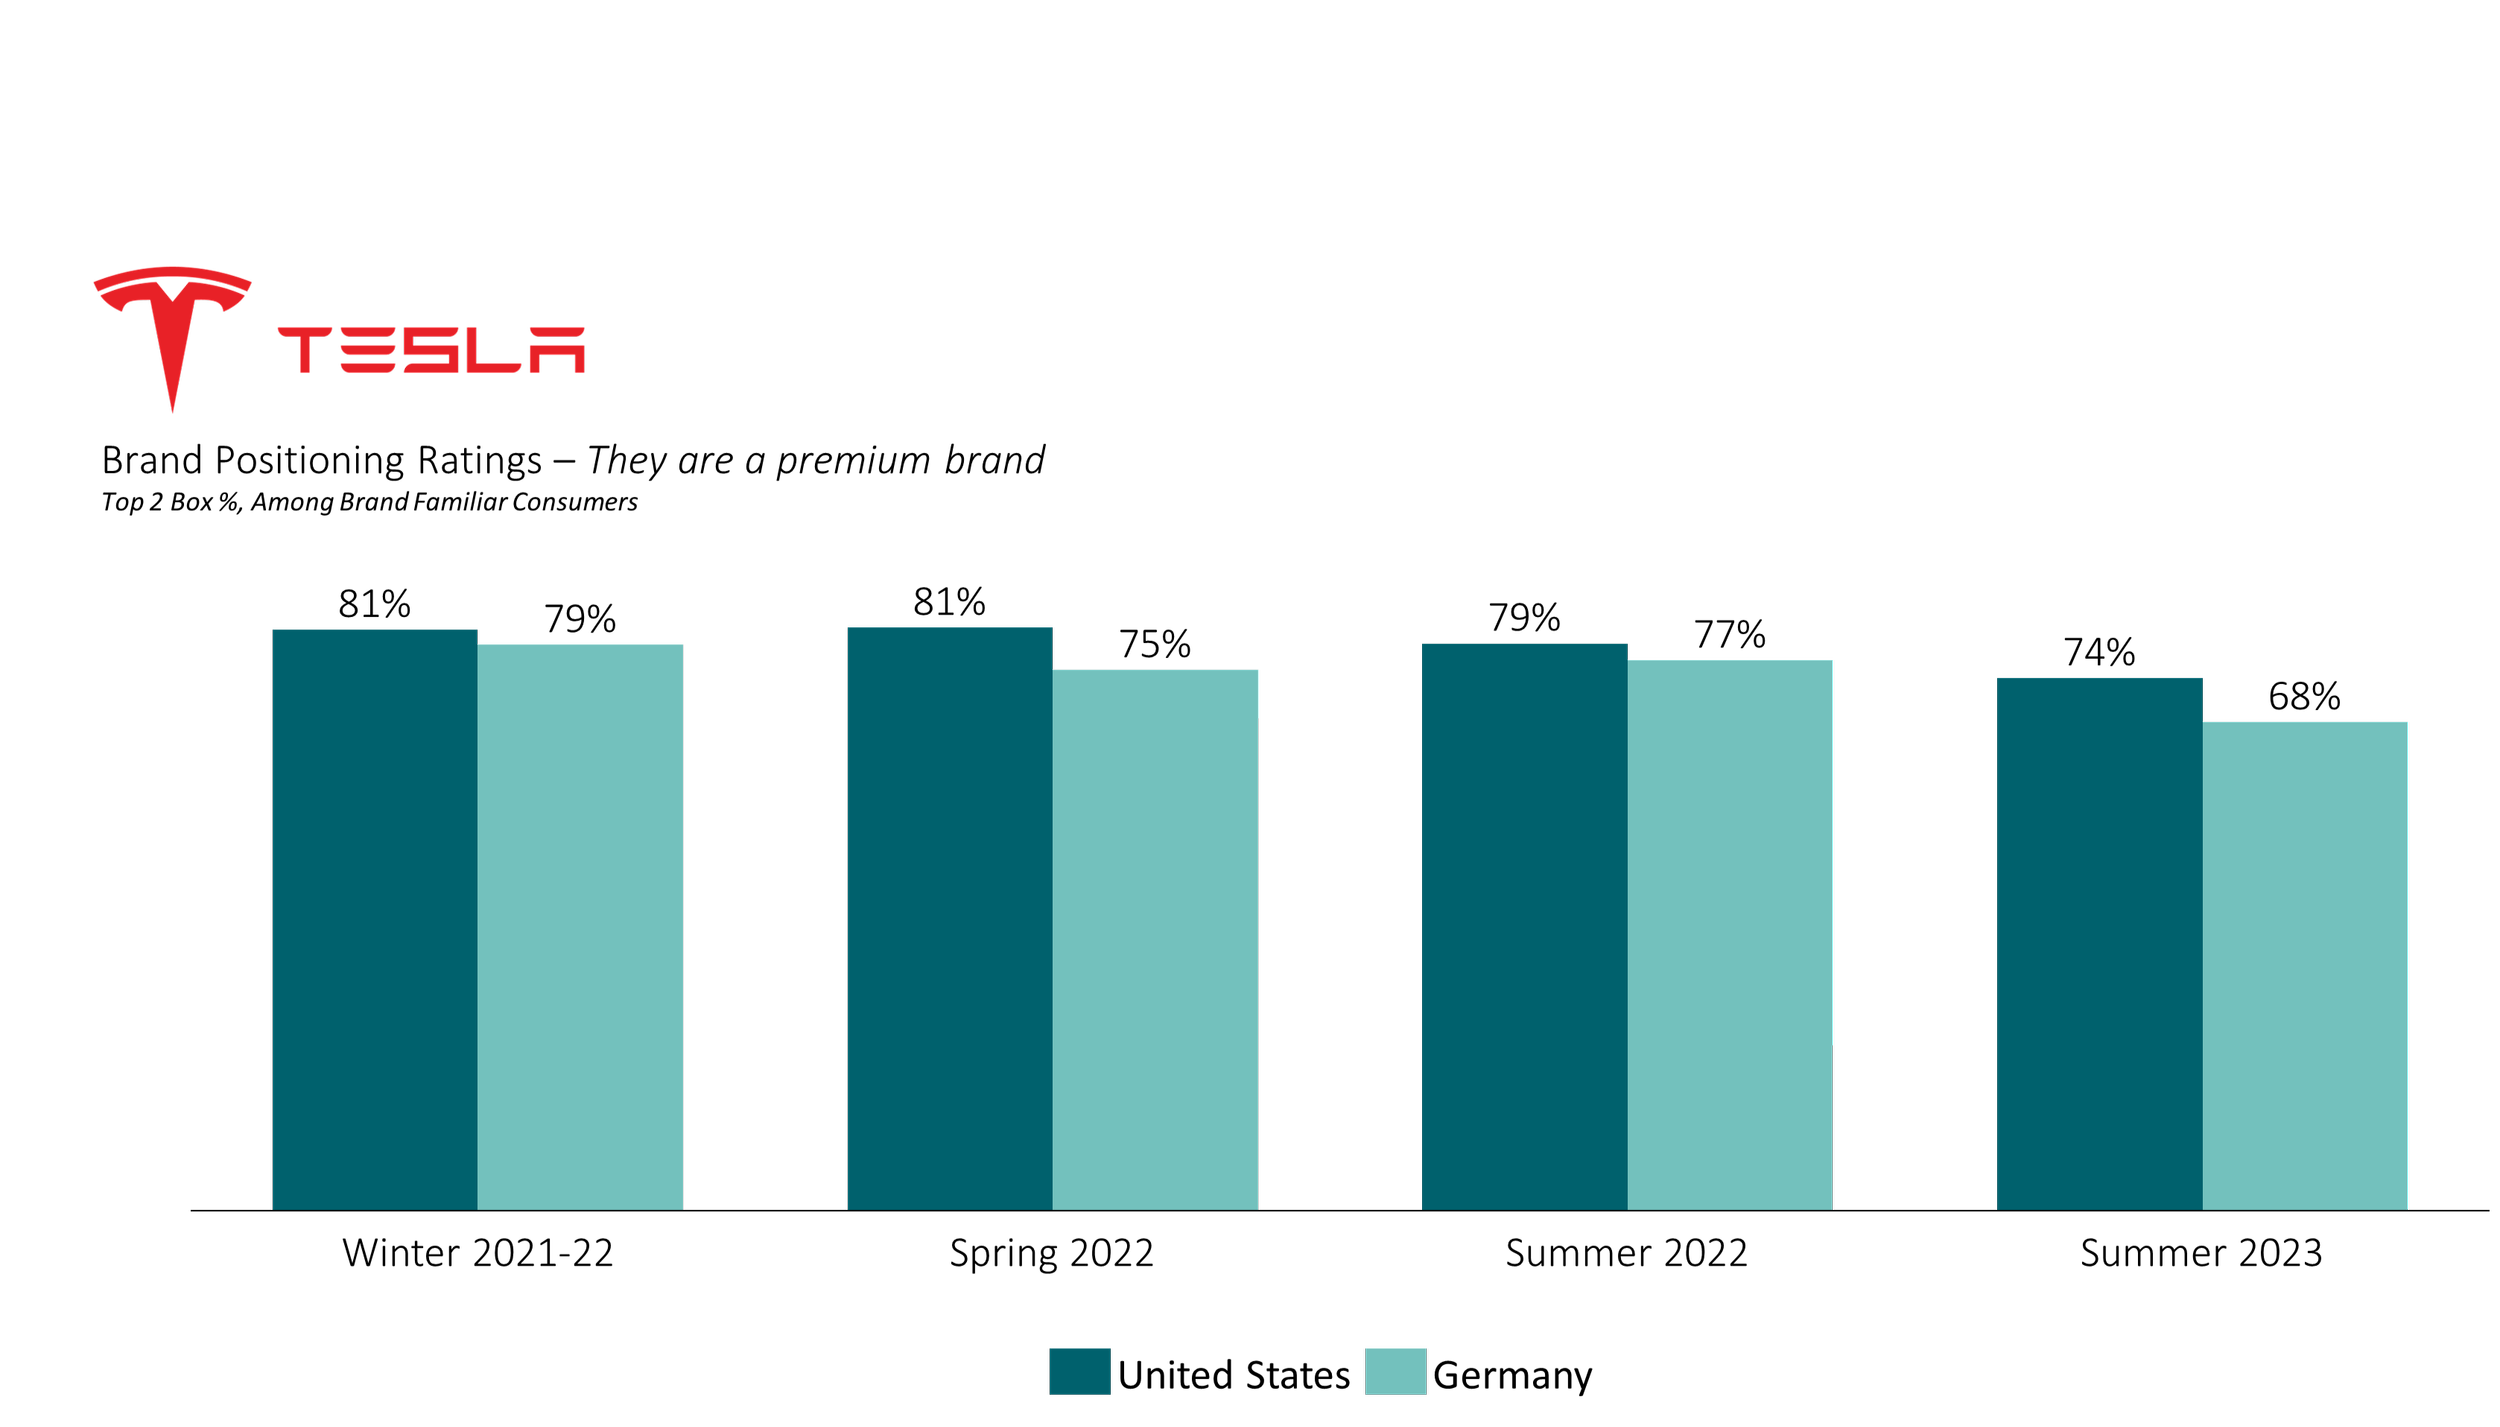
To combat this dynamic, Tesla must strike a balance between lowering prices and upholding its reputation for quality, especially given that the brand is most appealing to upper income consumers who are more likely to seek a premium car brand as a status symbol.
Insight 3: Upstart EV brands continue to gain ground in consumer awareness, most notably Rivian in the United States and NIO in Germany.
Two up-and-coming EV brands continue to show significant growth in top-of-funnel metrics in strategic markets, with Rivian gaining ground in the United States (+15% in aided awareness since summer of 2021) and NIO doing the same in Germany (+6% in aided awareness since summer of 2022).
However, both brands struggled to convert these improvements into broader brand familiarity and purchase consideration. Both brands continue to be much more well-known among upper income males, a key demographic. Therefore, both brands must continue to drive top-of-funnel growth while also establishing, a clear, memorable brand identity.

DISCLAIMER: We base our research, recommendations, and forecasts on techniques, information and sources we believe to be reliable. We cannot guarantee future accuracy and results. The Langston Co. will not be liable for any loss or damage caused by a reader’s reliance on our research.
More insights, more data. Download this study to learn more.
Thanks for taking time to read our research. With questions, comments, or suggestions about this study, please contact us at contact@thelangstonco.com.